kgschart-r
kgschart

kgschart is an R package for parsing KGS rank graphs into numeric data (KGS is an online platform for the game of go). It reads pixel information of image files to recover the data behind the line plot, and identifies the horizontal and vertical axis scales by reading labels and captions. A web application for using the package functionality is also published on shinyapp.io.
Installation
This package is now on CRAN. You can download by:
install.packages("kgschart")
Alternatively, you can download the latest version from the GitHub repository.
devtools::install_github("kota7/kgschart-r")
Usage
Main functionality
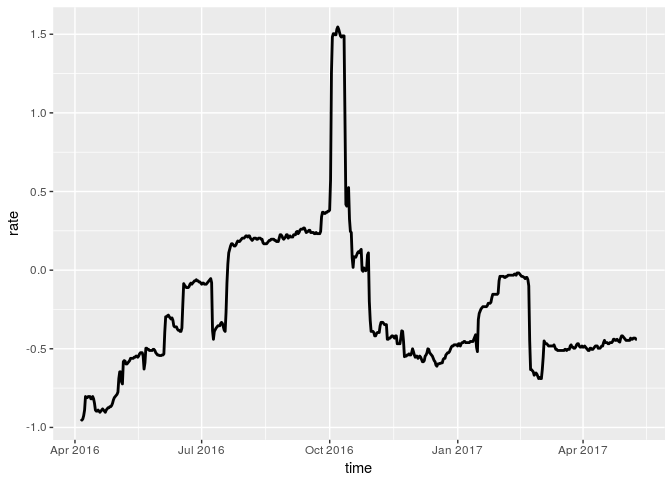
The main function of the package is also named kgschart. It takes an image file (png format) and parse the graph in it. The parsed data are stored in x$data as a data.frame with two columns, time and rate. rate is scaled so that dan’s are nonnegative and kyu’s are negative. For example, a 1k player has rate between -1 and 0, and a 3d player’s rate is between 2 and 3. The object supports plot method, which displays a line plot similar to the source image.
library(kgschart)
x <- kgschart(system.file("extdata/kotakun-en_US.png", package="kgschart"))
head(x$data)
##                  time       rate
## 1 2016-04-05 07:46:01 -0.9464286
## 2 2016-04-05 23:18:03 -0.9535714
## 3 2016-04-06 14:50:05 -0.9464286
## 4 2016-04-07 06:22:08 -0.9250000
## 5 2016-04-07 21:54:10 -0.8892857
## 6 2016-04-08 13:26:12 -0.8035714
plot(x)
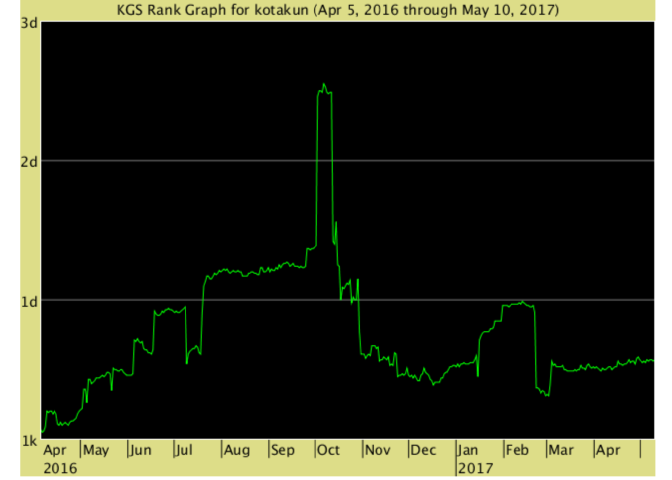
To see the source image file, set keep_image option. Then, the original image data is stored in the object, which can be shown by plot function with image option.
x <- kgschart(system.file("extdata/kotakun-en_US.png", package="kgschart"),
              keep_image=TRUE)
plot(x, image=TRUE)
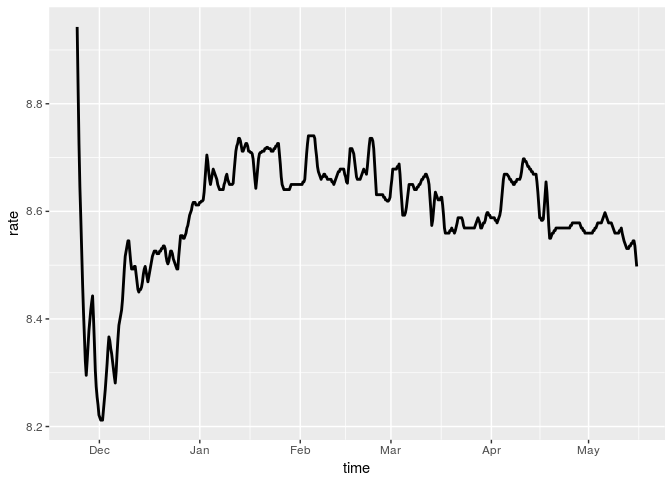
Rank graph downloader
If the image file has not been downloaded yet, but the player id is known, then use download_graph function. It retrieves the latest graph of a specified player from KGS archives, and return the downloaded file path.
f <- download_graph("Zen19L")
y <- kgschart(f)
plot(y)
Shiny app
kgschart_app function launches the browser applicaiton locally. The app is also published on shinyapps.io.
kgschart_app()